IA que trabaja
The problem: measuring real Copilot usage beyond code
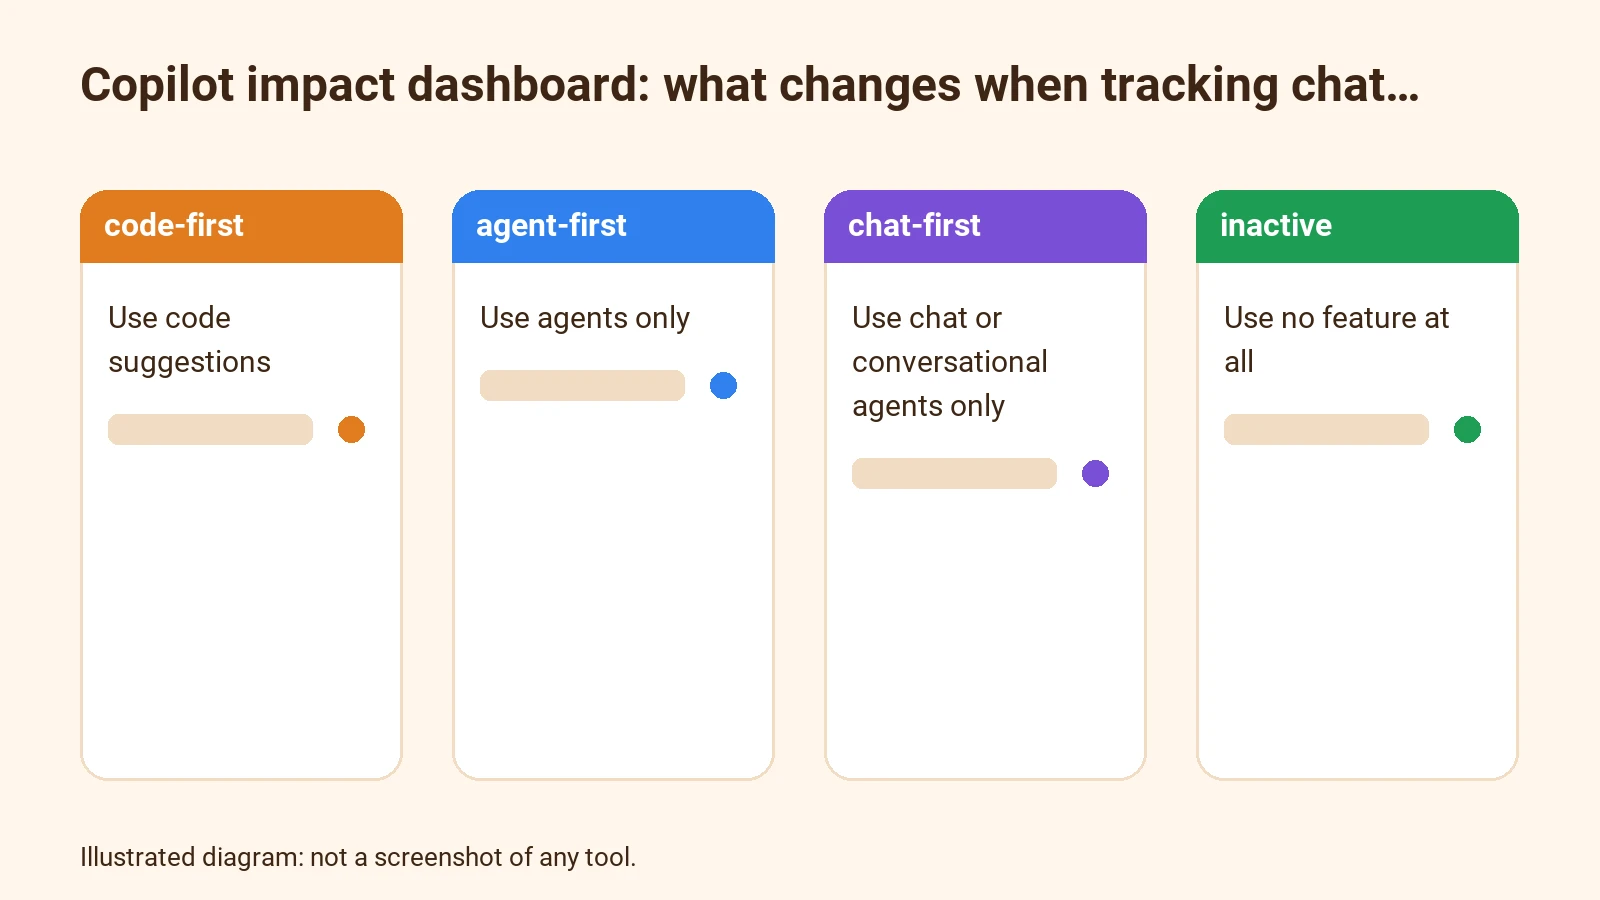
Until recently, tracking Copilot usage in companies was limited to classic functions: code suggestions, automated reviews, and other direct interactions with the editor. In practice, though, a significant share of users mainly interact with Copilot Chat or VS Code agents. These usage patterns were left out of the main metrics, leading to an incomplete picture of real adoption. For example, a team might have a considerable number of users who, even if they don't accept code suggestions, use the chat to resolve questions, request code snippets, or automate repetitive tasks via agents. This activity wasn't reflected in reports, so these users appeared as "passive" or disengaged, when in reality they were making use of AI in a different way.
This limitation had practical consequences. If you're responsible for justifying the Copilot investment or designing internal training, lacking visibility into conversational or agent-based usage made decision-making harder. Comparisons with other companies could also be skewed, since these alternative usage patterns weren't considered.
What's new in the dashboard: chat and agents as part of the picture
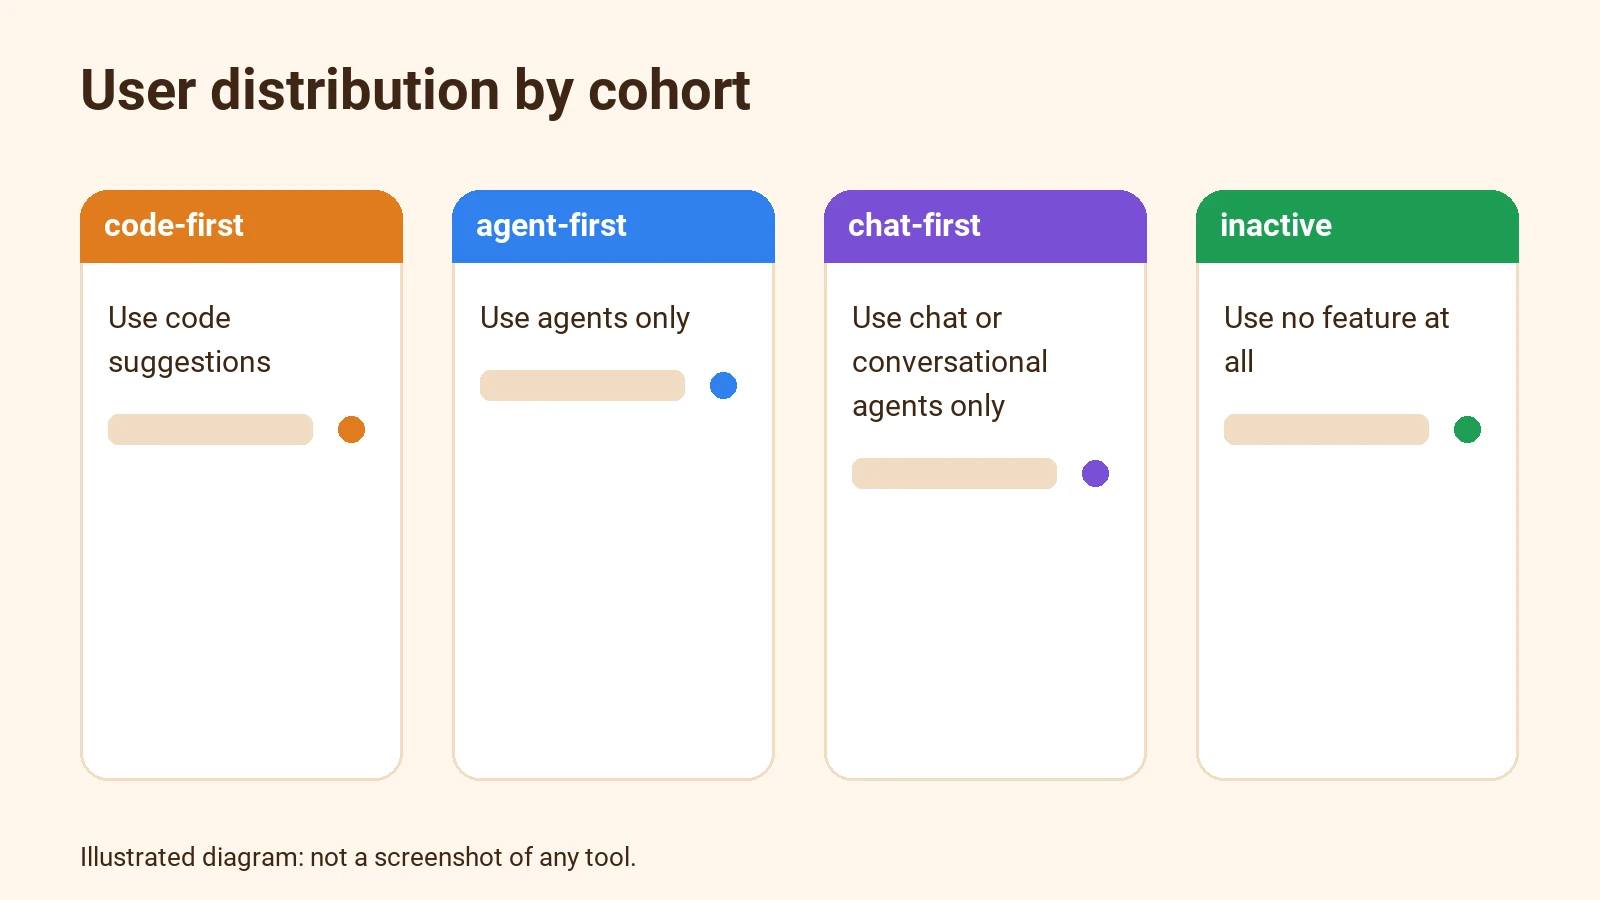
Since November 2026, the Copilot impact dashboard includes two new usage sources: Copilot Chat and the VS Code agent window. This means adoption and engagement reports now show activity in these features alongside the previous seven, like code suggestions, code review, test generation, and so on. The most visible change is that the cohort previously called "passive users" is now renamed "chat-first users," reflecting that their main interaction is conversational or via agents—not that they're inactive.
What does this mean for companies?
- You can identify how many users mainly interact via chat or agents, even if they don't use other features.
- Adoption analysis is more accurate, since users who use Copilot conversationally or through agents are no longer labeled as passive.
- Comparisons with other companies (industry comparison) now include these usage patterns, giving a more realistic view of your position in the sector.
This change doesn't alter the adoption phases, but it does affect how engagement and depth of use are interpreted. Now, your company can distinguish between those who use Copilot in the traditional way and those who use it conversationally or via agents, allowing you to tailor training and follow-up strategies to each cohort's profile.
How the new data appears in reports
Chat and agent data appear in 28-day usage reports for organizations and companies. A user is considered "engaged" with a feature if they've used it at least two days within that period. The same user can be active in several features if they combine different types of usage.
For example, if someone uses Copilot Chat on three days and accepts code suggestions on two others, they'll appear as "engaged" in both features. If they only use chat or agents, they'll be classified as "chat-first."
Cohorts and adoption phases
- Adoption phases are unchanged: chat and agents are reported as engagement, but don't count toward advancing phases.
- The "chat-first" cohort (formerly "passive") groups those who only use chat or agents, without other qualifying features.
- In the API and reports, these users appear as "No Cohort."
This allows you to segment your workforce more effectively and see if there are teams that prefer conversational interaction, which can influence training or the promotion of other Copilot features.
Example: analyzing adoption after the change
Let's walk through a hypothetical example, based on the real structure of reports and cohorts, to show how measurement changes and what extra information you get after the dashboard update.
Initial situation (before November 2026)
Suppose a company has 100 Copilot users. The 28-day adoption report shows:
- 40 users appear as "code-first" (use code suggestions at least two days).
- 20 users appear as "agent-first" (use code agents, but not other features).
- 20 users appear as "passive" (only use chat, but this activity isn't reflected in the metric).
- 20 users haven't used any feature (inactive).
In this scenario, the company sees 20% "passive" users, but can't tell if they're actually using Copilot in another way. If they check the industry comparison, they only see adoption data based on code suggestions and classic agents.
Situation after the update (after November 2026)
With the new dashboard version, the 20 users who previously appeared as "passive" are now identified as "chat-first." Their activity in chat and the VS Code agent window is now shown in reports. The breakdown is:
- 40 "code-first" users
- 20 "agent-first" users
- 20 "chat-first" users
- 20 inactive users
Now, the company can see that those 20 users are interacting with Copilot, even if not in the traditional way. They can analyze whether to encourage combined feature use, or if the conversational profile is enough for their goals.
Possible entries and states
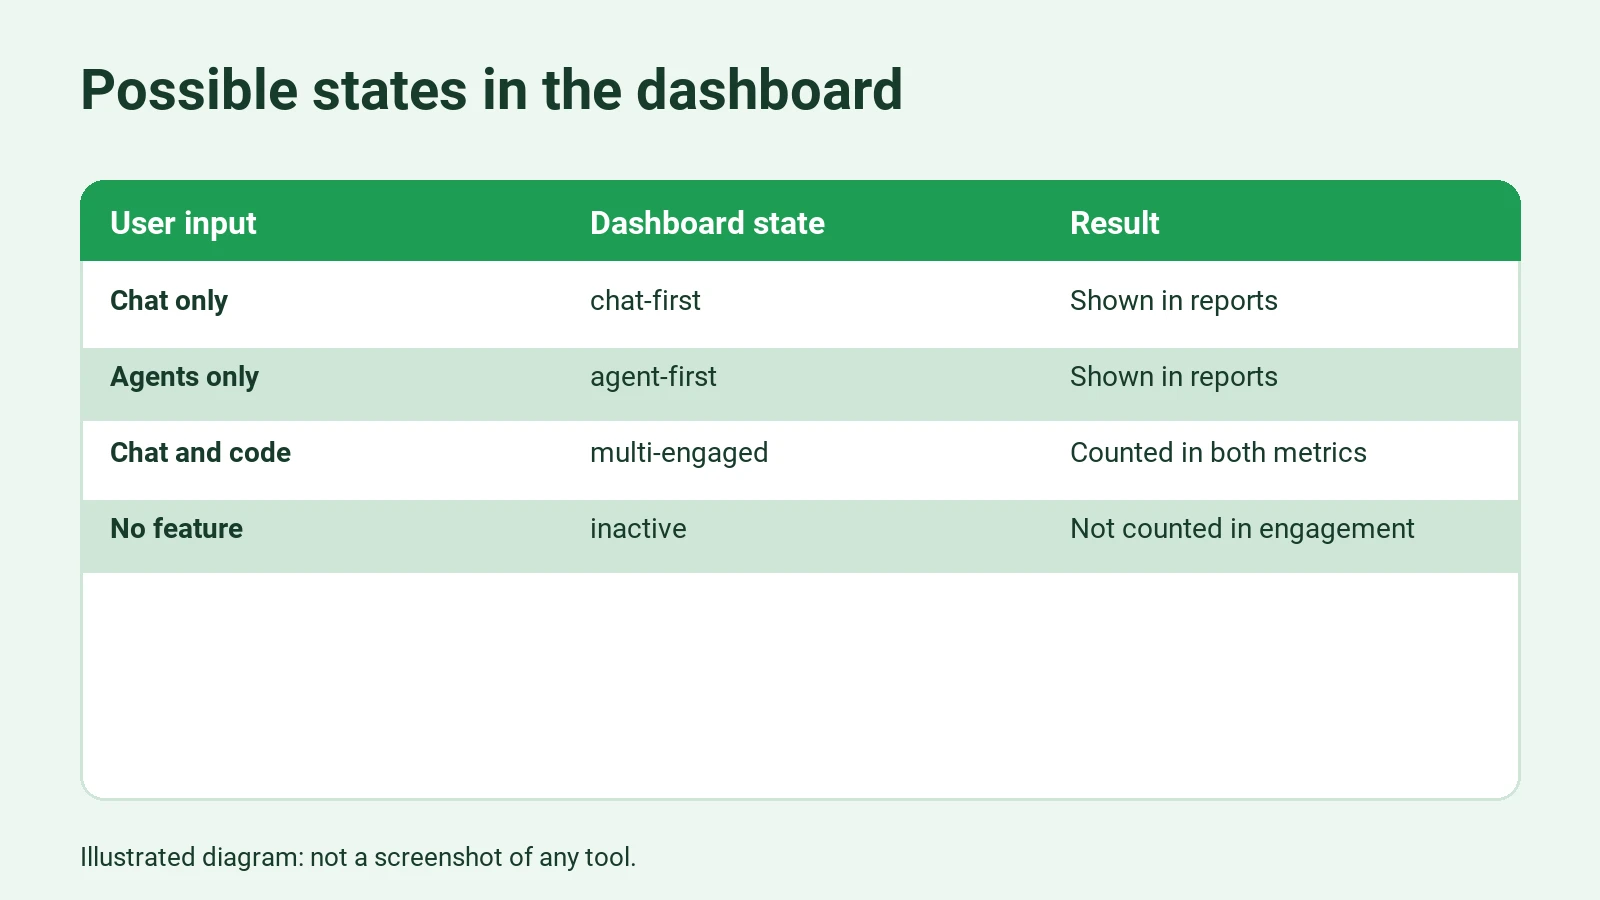
In this example, the possible entries and states in the dashboard after the change are:
- User only uses chat: Appears as "chat-first."
- User only uses agents: Appears as "agent-first."
- User uses chat and code suggestions: Appears in both metrics ("engaged" in chat and code), and is classified by the most-used feature.
- User doesn't use any feature: Remains inactive.
- User uses chat and agents, but not code suggestions: May appear as "chat-first" or "agent-first" depending on engagement criteria.
Expected results
- The dashboard shows chat and agent activity separately.
- The "chat-first" cohort appears in reports, allowing you to identify this usage pattern.
- Industry comparison now includes these data, which may change your company's relative position.
- If you download the report via API, the "chat" and "vscode_agent" fields appear in the JSON with aggregated data.
Errors and things to check
- If the metrics policy isn't enabled, chat and agent data won't appear.
- If you check a report from before November 2026, these metrics aren't included.
- If a user lacks sufficient permissions, they can't access the dashboard or API.
- If the company hasn't opted into industry comparison, they won't see data from other companies.
Checklist table
| User input | Dashboard state | Expected result | Possible error |
|---|---|---|---|
| Only uses chat | chat-first | Reflected in reports | Doesn't appear if no metrics |
| Only uses agents | agent-first | Reflected in reports | - |
| Uses chat and code suggestions | multi-engaged | Appears in both metrics | - |
| Uses no features | inactive | Not shown in engagement | - |
| Checks old report | - | Doesn't see chat/agents | Metrics not available |
| Lacks permissions | - | Can't access dashboard | Access denied |
This example shows how the dashboard update lets you distinguish usage patterns more clearly and avoids classifying as passive those who do interact with Copilot, even if in a non-traditional way.
Verifiable steps to make use of the new dashboard
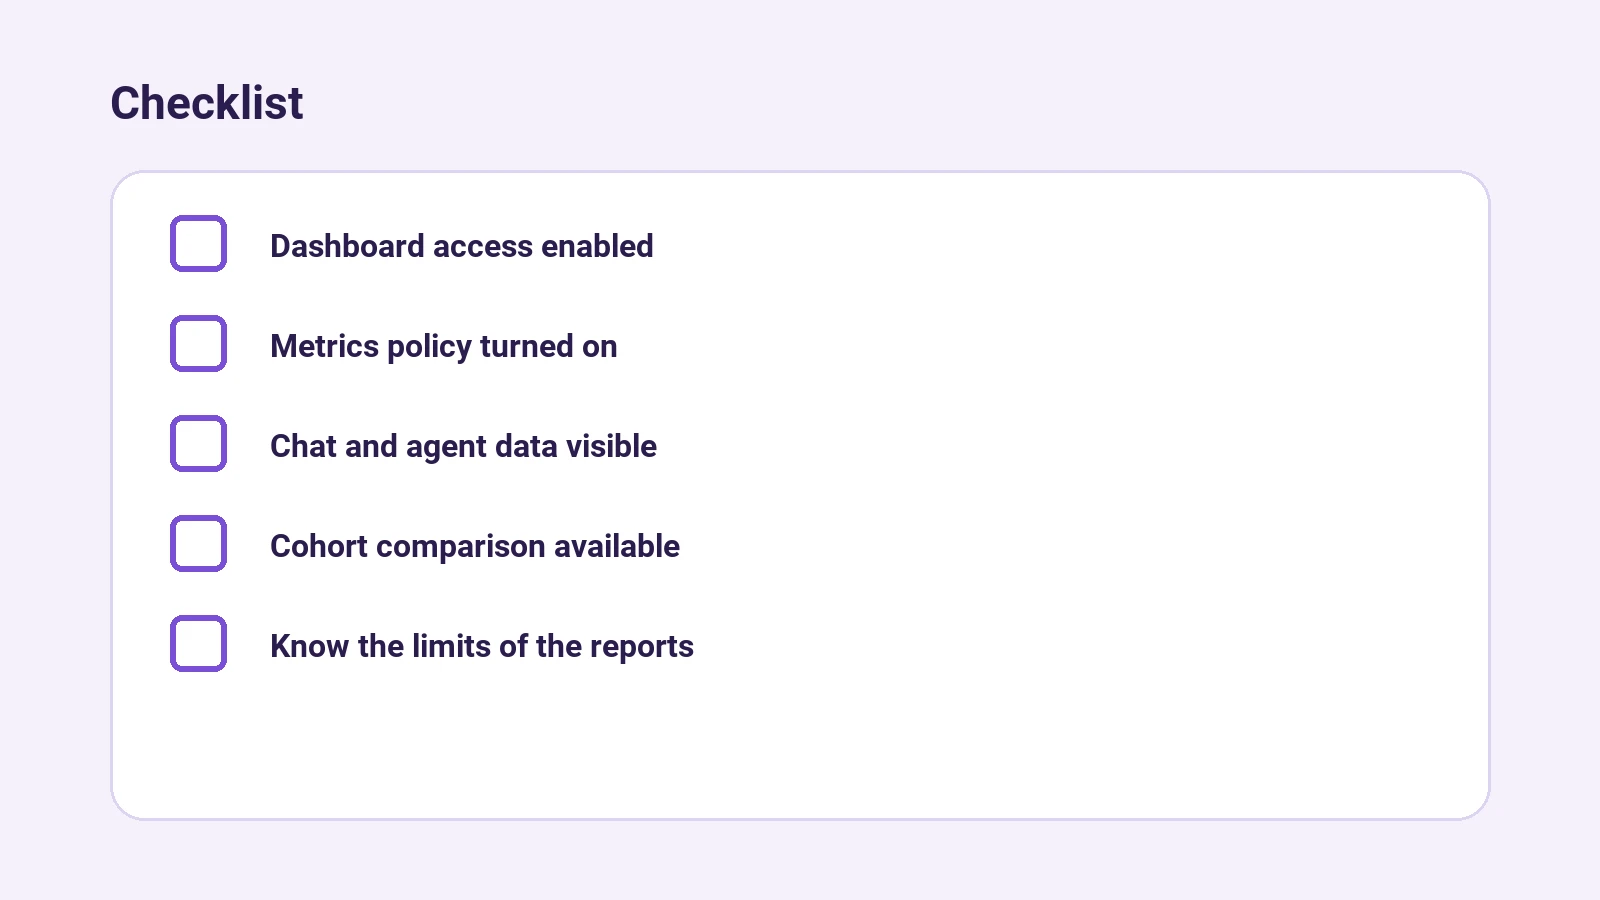
- Access the Copilot impact dashboard: You need to be an organization owner or have permission to view Copilot metrics. The official documentation explains how.
- Enable the metrics policy: Data collection must be enabled for the new sources to be tracked.
- Review the 28-day reports: Check that chat and agent entries appear in the adoption chart.
- Analyze the chat-first cohort: See how many users are in this category and if there are changes compared to previous reports.
- Use industry comparison: If enabled, compare chat and agent adoption with similar companies.
- Extract reports via API if needed: You can download aggregated data for your own analysis, as long as you have the right permissions and scopes.
Costs and requirements
Copilot cost and dashboard access
Access to the impact dashboard and detailed metrics requires a Copilot Business or Enterprise subscription. Copilot pricing for companies is published on GitHub's official page and may vary by plan and country. The dashboard is only available to roles with admin or metrics permissions.
Technical requirements
- Metrics policy enabled at the company or organization level.
- Copilot licenses assigned to users.
- API access requires additional permissions and, in some cases, use of tokens with the appropriate scope.
Limits and considerations
- Chat and agent data only appear in company or organization reports, not at the individual user level.
- Historical reports from before November 2026 don't include these metrics.
- The chat-first cohort doesn't count toward advancing adoption phase, though it does count for engagement.
- Industry comparison depends on enough companies participating in the same category.
- The dashboard doesn't measure interaction quality, only frequency of use.
Comparison table: before and after the change
| Metric | Before November 2026 | After November 2026 |
|---|---|---|
| Chat and agents in reports | No | Yes |
| "Passive" cohort | Yes | Renamed to "chat-first" |
| Chat/agent adoption | Not visible | Visible |
| Phase advancement via chat | No | No |
| Industry comparison | No chat/agents | Includes chat/agents |
What to check and what to do if it fails
| What to check | What to do if it fails |
|---|---|
| Access to dashboard | Check permissions and organization role |
| Chat and agent metrics visible | Enable metrics policy |
| Chat-first cohort appears | Wait for report update |
| Industry comparison available | Opt in to participate in the widget |
| Reports downloadable via API | Check token scopes and permissions |
Frequently asked questions
Why do some users only appear as chat-first?
Because their main interaction is through chat or agents, without using other features that count toward adoption phase. This is common for users who use Copilot as a conversational assistant.
Can I see individual chat and agent usage?
No, reports aggregate data at the company or organization level. For individual analysis, you'd need to combine other sources or tools.
How does this affect return on investment?
It lets you see if part of your workforce is using Copilot differently than expected and adjust training or goals. The dashboard includes indicative ROI estimates by cohort.
What if I don't see the new data?
Make sure the metrics policy is enabled and that reports cover dates after November 2026. If the issue persists, check permissions or contact support.
Can I export the report with the new data?
Yes, using the Copilot metrics API with the right permissions you can download aggregated reports for your own analysis.
Conclusion
Adding chat and agents to the Copilot impact dashboard improves visibility into how AI is actually used in development teams. While it doesn't change adoption phases, it does help you better understand usage patterns and compare with other companies. To get the most out of it, review the new metrics and adjust your training and monitoring strategy.
If you need help analyzing Copilot usage or automating metrics extraction, you can check our automation services with n8n and Make, or expand your training at Academy IA que trabaja.
For more context on automation and metrics, see the article How to measure the cost of an automation with n8n and detect recurring failures.
If you want to learn how to set it up
If you want to learn how to build things like this step by step, there are practical courses at El Atajo.
Sources
- <https://github.blog/changelog/2026-11-06-copilot-impact-dashboard-adds-chat-and-vs-code-agent-usage/>
- <https://docs.github.com/en/copilot/how-tos/administer-copilot/view-impact-dashboard>
- <https://docs.github.com/en/rest/copilot/copilot-usage-metrics>